SF Standard Redesign
2024
Threads
2023
Contextual Navigation
2021
Points of Interest
2020
101 Best Restaurants
2019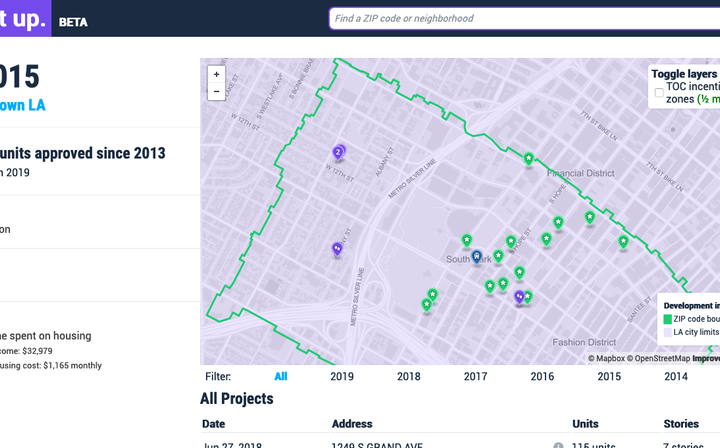
Add it up.
2019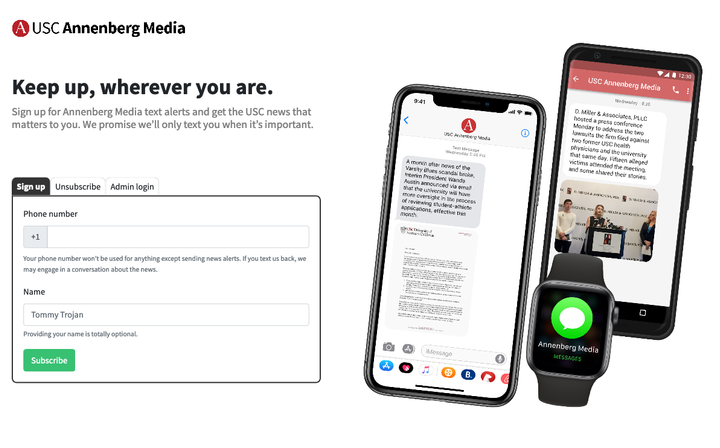
Annenberg Media text alerts
2019
echo
2019
L.A. Times Food
2019
News fluency
2019
American (In)Justice
2018
Annenberg Media ethics & policies
2018
Crosstown
2018
Shook Beyond Words
2018
USG debate chatbot
2018
Annenberg Media social rebrand
2017
Annie
2017
Neon
2017
Ripple Effect Phoenix
2017
The Rundown
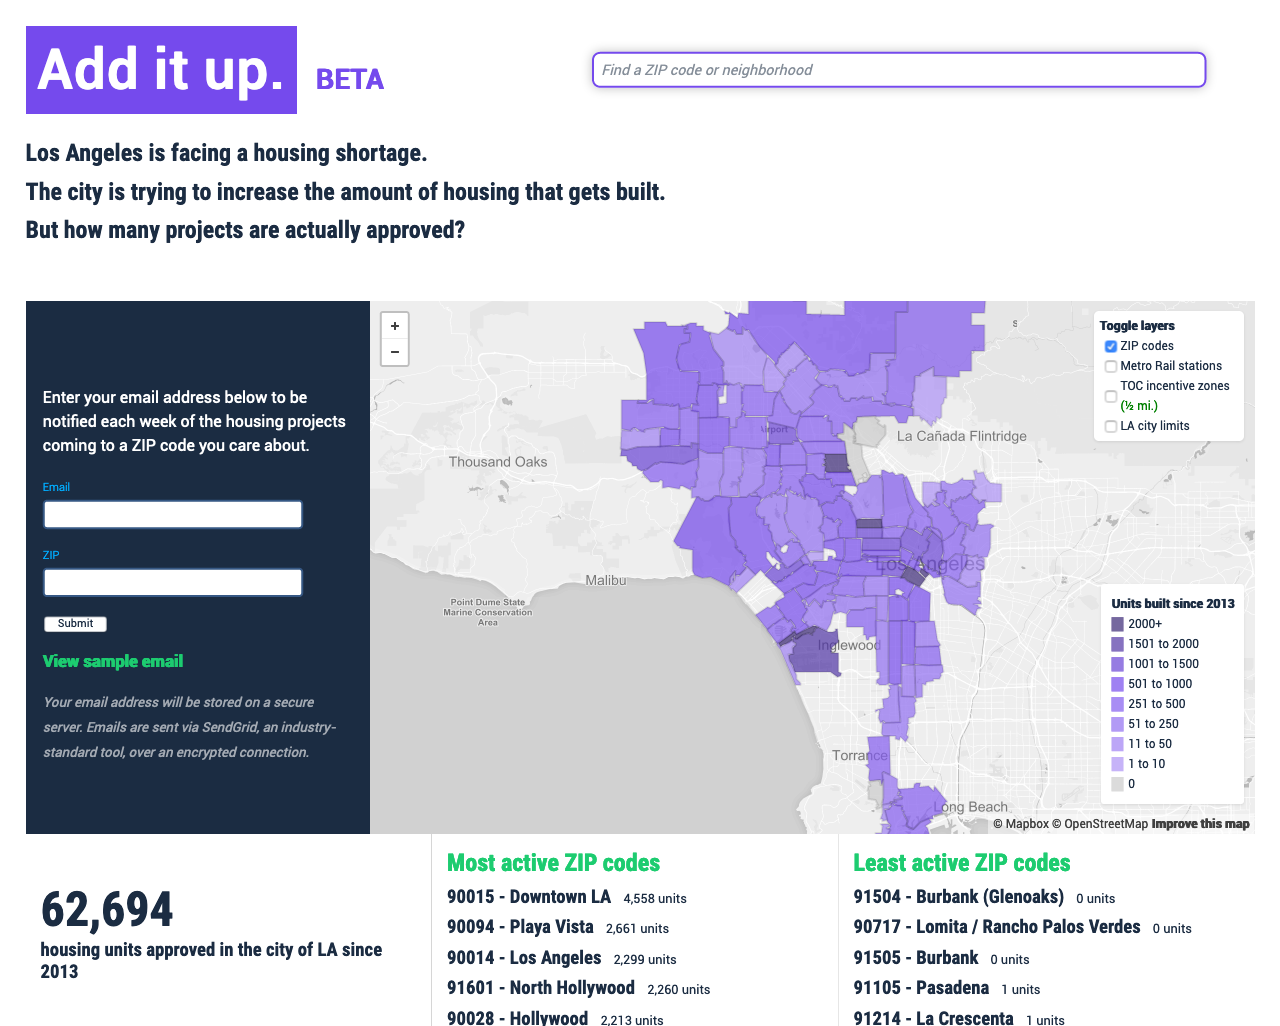
2017Add it up.
As part of a course entitled “Journalism and the Audience,” students were asked to spend the semester reporting on a specific subject matter and to use design thinking in presenting that material to a particular audience. I chose to present information on housing as my subject matter, but rather than rely heavily on text reporting, I used Los Angeles city open data to create something that enables users to explore citywide housing construction for themselves.
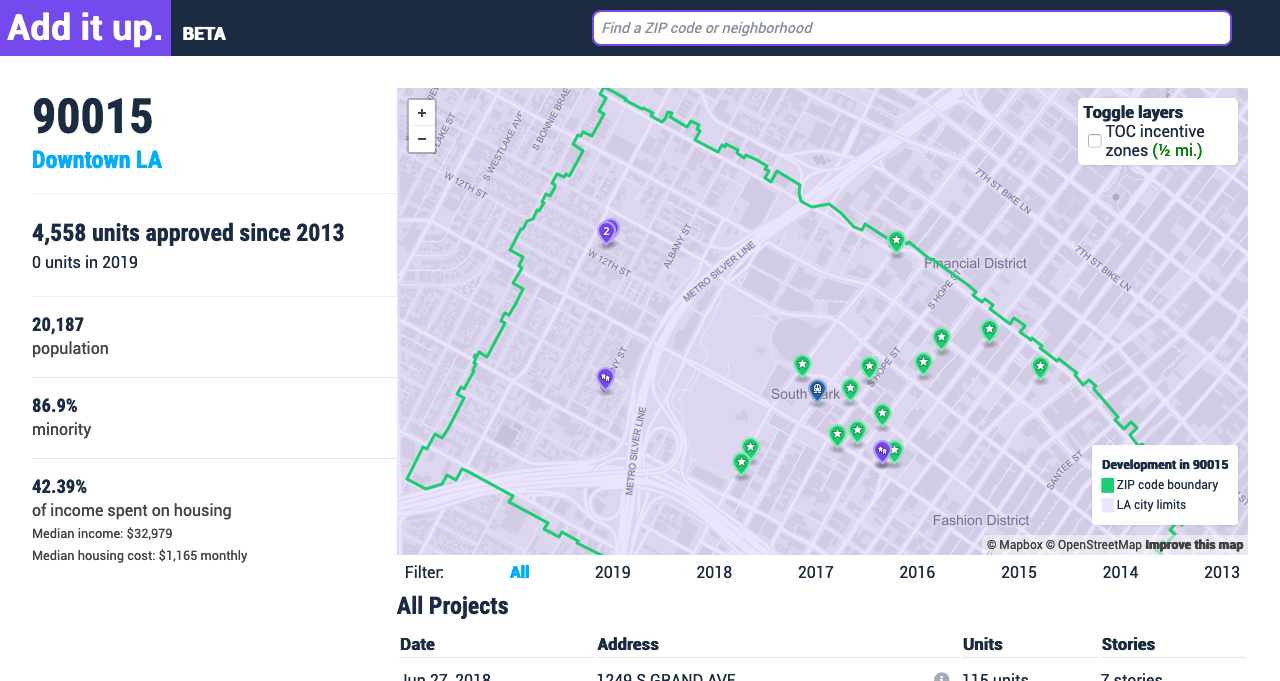
The project had several parts: a weekly email newsletter for a specific ZIP code that alerts users to changes on the hyperlocal scale; a website displaying interactive maps on the ZIP code and city scale to explore differences in construction patterns and change over time; and a set of written summaries, using insights from housing experts, to explain some patterns on the city scale.
Data was obtained weekly and then cleaned and organized using a Python program. Another Python program sent emails using the SendGrid API. The website was built using Node.js, Express, and Handlebars on the back-end and Mapbox.js and VueJS on the front-end.
This project is no longer maintained and no longer available, but you can browse its code on GitHub.